Student Achievement Measures
Student Achievement Measures
In keeping with the mission and Strategic Plan, Richard Bland College evaluates the following metrics
- 150% Graduation Rate by Fall Cohort
- Retention by Fall Cohort
- Internal Persistence by Fall Cohort
- 4-Year Baccalaureate Completion
- Dual Enrollment Measures
- Percentage of students earning a C or better in DE classes
- Associate’s degrees granted to DE students
150% Graduation Rate by Fall Cohort
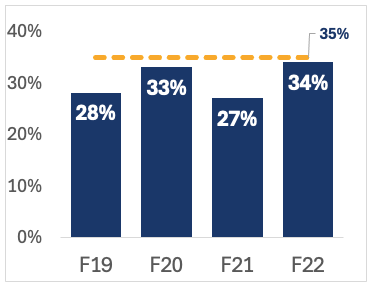
The College strives to attain a 35% three-year graduation rate.
IPEDS 150% Graduation Rate, 2019-2022 Cohorts
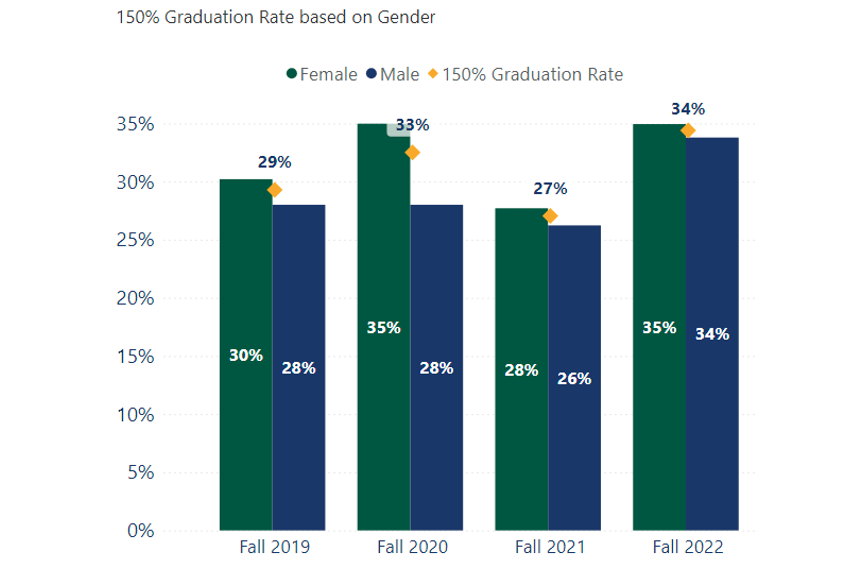
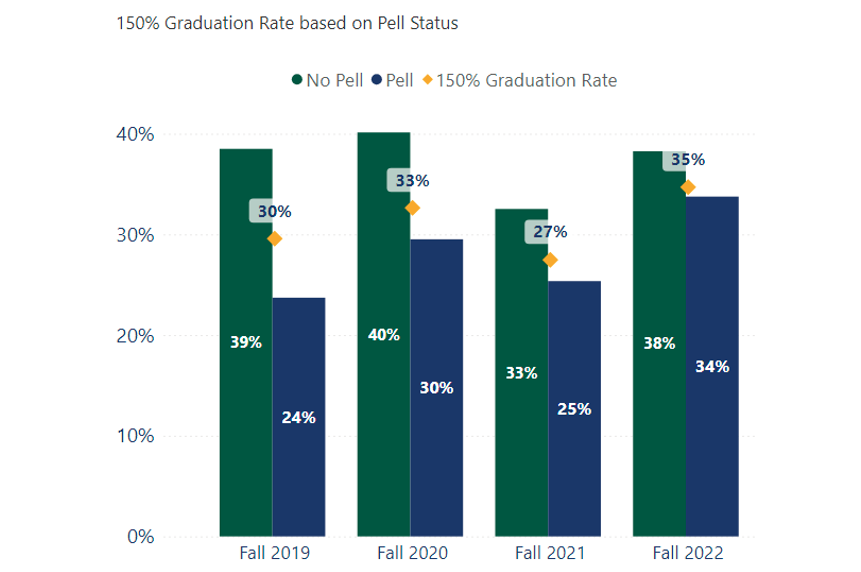
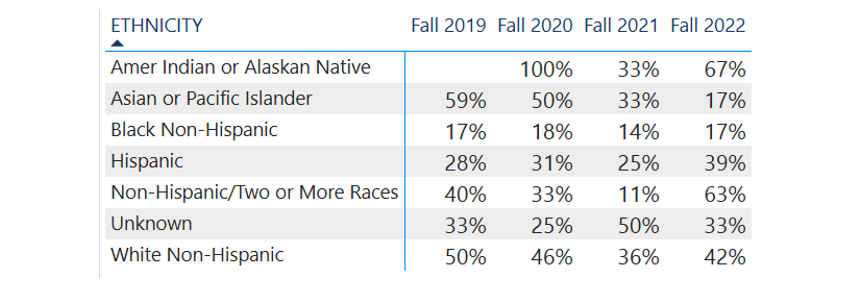
The College also measures the graduation rate among different student populations based on gender, race/ethnicity, and socioeconomic status. RBC aims for each group to meet the target graduation rate of 35%.
150% Graduation Rate based on Ethnicity
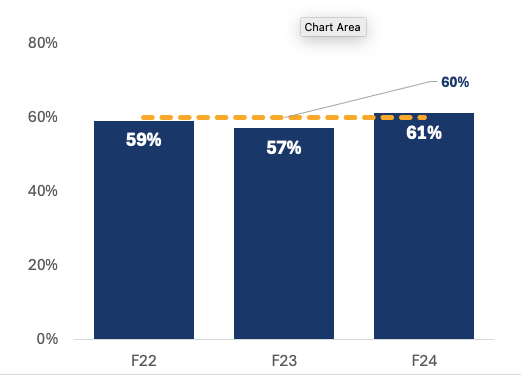
Retention by Fall Cohort (Fall to Fall)
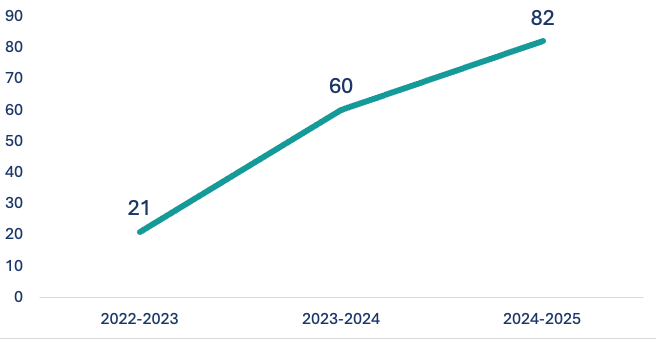
Retention is an institutional performance measure with a target of 60%
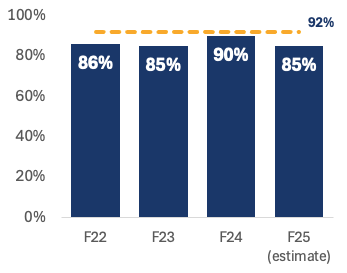
Internal Persistence by Fall Cohort (Fall to Spring)
The College’s strategic target goal for student persistence is 92%
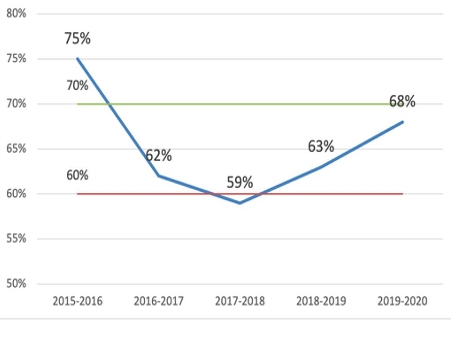
4-Year Baccalaureate Completion
While Baccalaureate completion is not part of the Richard Bland mission, we do monitor the baccalaureate completion of our transfer students. Its target goal for Baccalaureate completions is 70% of all transfer studentsand its threshold is 60%.
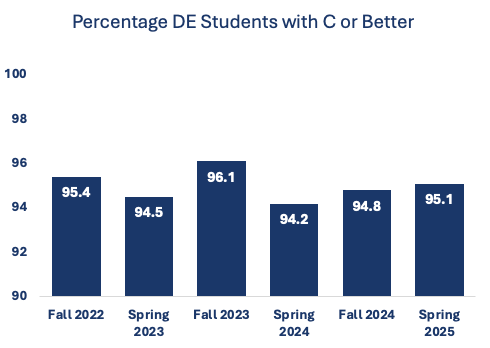
Dual Enrollment Measures
Percentage of Students Earning a C or Better in DE Class, Fall 2022-Spring 2025
DE Students Earning Associate’s Degrees 2023-2025